
Transport Fever 3 performance problems usually fall into two different categories: low frame rate caused by rendering load, or a slow simulation caused by CPU load. Pause the game first. If the frame rate remains low while paused, the GPU is the likely bottleneck. If the paused game is smooth but selecting 2× or 4× speed barely accelerates vehicles—or makes their movement appear uneven—the CPU is more likely limiting the simulation.
Do not begin by lowering every setting at once. Compare paused rendering with active simulation, watch CPU, GPU, RAM, and VRAM usage, and then change the settings connected to the limiting component. Graphics reductions can help a saturated GPU, but they usually have little effect when the processor cannot simulate a large, complex transport network quickly enough.
Minimum and recommended system requirements are compatibility baselines, not guaranteed frame-rate targets. Performance can still decline as a map accumulates cities, vehicles, industries, traffic, connections, and demanding mods.
Identify the type of slowdown first
Use the same save, camera position, and display resolution for each test. A busy overview of a developed area is more useful than comparing unrelated parts of the map.
| What you observe | Likely limit | What to check next |
|---|---|---|
| Frame rate stays low while the game is paused | GPU or graphics-side load | GPU utilization, resolution, graphics quality, dedicated-GPU selection, and VRAM use |
| Paused rendering is acceptable, but 2× or 4× speed produces little extra simulation speed | CPU simulation load | Individual CPU-core load, map complexity, vehicle count, traffic, industries, connections, and demanding mods |
| GPU usage is consistently full | GPU rendering capacity | Resolution, Resolution Scale, anti-aliasing, shadows, geometry, reflections, ambient occlusion, terrain, and grass |
| VRAM use is close to the graphics card’s capacity | Graphics memory pressure | Texture quality and mods containing unnecessarily high-resolution textures or complex models |
| RAM use is high or performance worsens with other applications open | System-memory pressure | Background applications, installed memory, and whether the problem changes after closing other programs |
| Neither CPU nor GPU appears fully used | A less obvious bottleneck | Individual CPU cores, RAM throughput, VRAM, thermal throttling, power-saving settings, drivers, and hardware configuration |
These are diagnostic indicators, not absolute proofs. A system can have more than one limit, and a change that helps one save or camera view may not produce the same result on a much larger network.
Start with a repeatable performance test
- Load the save where the slowdown is easy to reproduce.
- Move the camera to a busy location and keep the camera position unchanged during the first comparison.
- Pause the simulation and observe whether rendering remains slow.
- Resume at normal speed, then select 2× and 4× speed. Watch whether the world actually advances faster and whether vehicles begin to jump.
- Check total GPU utilization, VRAM use, total RAM use, and the load on individual CPU cores while the game is running.
- Record the current resolution, display mode, graphics preset, and any demanding visual mods before changing them.
- Change one group of settings at a time, return to the same view, and repeat the paused and accelerated tests.
On a computer with multiple graphics processors, also confirm that Transport Fever 3 is using the dedicated graphics card. Running on an integrated or lower-power GPU can make a graphics bottleneck appear even when the machine contains a stronger card.
Close unnecessary background applications before repeating the test. This creates a cleaner comparison and can reveal whether system memory or another process is contributing to the slowdown. On laptops, check for power-saving behavior and thermal throttling as well. Both can reduce available CPU or GPU performance during a long session.
Tune graphics for a paused low-FPS problem
If performance remains poor while the simulation is paused, start with resolution and the settings that affect scene rendering. Start by reducing resolution, anti-aliasing, shadow quality, texture quality, level of detail, and other GPU-intensive effects.
Moving from 3840×2160 to 1920×1080 substantially reduces the number of pixels the GPU must render. The in-game Resolution Scale can also reduce the rendering resolution of the main viewport. Use it to adjust rendering resolution while keeping that test separate from other graphics changes.
Use this order so each test has a clear purpose:
- Reduce the output resolution, especially when moving from 4K/UHD to Full HD is acceptable.
- Lower Resolution Scale if you need another way to reduce the main viewport’s rendering load.
- Reduce anti-aliasing and shadows.
- Lower geometry or level-of-detail-related quality when dense scenes remain expensive to render.
- Reduce reflections and disable or lower other effects such as ambient occlusion when necessary.
- Reduce terrain and grass quality if wide outdoor views remain slow.
- Lower texture quality when VRAM is close to capacity rather than assuming textures are the primary cause of every low-FPS problem.
- Retest the same paused view after each group of changes.
The graphics presets use the following combinations:
| Setting | Low | Medium | High | Very High |
|---|---|---|---|---|
| Textures | Low | High | High | Very High |
| Terrain textures | Low | High | High | Very High |
| Anti-aliasing | Off | 2× | 4× | 4× |
| Ambient occlusion (SSAO) | Off | On | On | On |
| Reflections (SSR) | Off | Medium | High | High |
| Geometry | Low | Medium | High | High |
| Shadows | Low | Medium | High | High |
| Terrain | Low | Medium | High | High |
| Grass | Off | Medium | High | High |
A preset is a useful diagnostic shortcut, but it is not a universal optimized configuration. For example, a card with limited VRAM may benefit from lower textures, while a different GPU may have enough memory but struggle more with resolution, shadows, or geometry. After testing a lower preset, raise individual settings only while the same comparison remains smooth enough for your target.
VSync can be enabled or disabled in the graphics settings. Test it only after identifying the main bottleneck, because changing VSync does not remove the rendering or simulation work responsible for a saturated GPU or CPU.
Diagnose a slow 2× or 4× simulation
A simulation bottleneck has a different signature from a graphics bottleneck. The paused view can remain reasonably smooth, yet increasing game speed produces little real acceleration. Vehicles may also start to jump because the processor cannot complete simulation work at the requested rate.
Transport Fever 3 continuously simulates vehicles, cities, industries, transport connections, road traffic, cargo relationships, and other systems. The amount of work rises as a map and its network grow. Large or highly developed saves are particularly demanding when they contain many cities, dense transport networks, large vehicle fleets, complex road traffic, many industries and cargo connections, or demanding mods.
Check individual CPU-core utilization rather than relying only on the total CPU percentage. If one or more cores are heavily loaded while the GPU is not fully utilized, the simulation is the more likely limit. A low total percentage does not rule this out because total utilization can hide heavily loaded individual cores.
Reducing graphics settings usually has little effect on this type of CPU limitation. Lowering textures, shadows, or output resolution may free GPU capacity, but it does not remove the need to simulate the developed map. Use graphics changes only if the paused rendering test also reveals a GPU problem.
For a cleaner diagnosis:
- Compare normal, 2×, and 4× speed in the same area.
- Compare the affected developed save with a less complex save, if one is available.
- Check whether disabling a demanding mod for a controlled test changes the result, while respecting that removing mods from an existing save can affect compatibility.
- Close background applications that compete for processor time or memory.
- Check for laptop power-saving settings and thermal throttling.
- Treat fewer towns with fewer connections as less CPU-intensive than many closely placed towns with more connections.
Use the measurements in your current save instead of adopting a universal city count, vehicle limit, or network size.
Resolve VRAM, RAM, and mixed bottlenecks
Low performance can persist even when both the processor and graphics card exceed the listed minimum requirements. Possible causes include insufficient system memory, limited VRAM, background applications, slower RAM throughput, an older mainboard with a slower PCIe slot, thermal throttling, power-saving behavior, outdated graphics drivers, very high display resolutions, and demanding mods.
When VRAM use is close to the capacity of the graphics card, lower texture quality first and retest. Mods containing unnecessarily high-resolution textures without appropriate levels of detail can add substantial graphics-memory and rendering pressure. Disable suspect visual mods for a controlled comparison instead of assuming the base game is the only source of the load.
When system RAM is heavily used, close other applications and repeat the same test. If the result changes, memory pressure or background work was contributing to the problem. If performance remains unchanged, return to the paused-versus-simulation comparison and look for a clearer GPU, individual-core, or VRAM limit.
Driver age is one possible factor, but a driver update should not be presented as a cure for a CPU-bound simulation. Likewise, lowering texture quality can help when VRAM is full, but it is not a general solution for every slow map. Match each change to the evidence shown by the system monitor and the in-game test.
Compare your hardware with the system requirements
Use these requirements to check compatibility and obvious capacity gaps. Do not treat them as promised FPS levels for every map size or graphics preset.
| Platform | Tier | Processor | Memory | Graphics | Other requirements |
|---|---|---|---|---|---|
| Windows | Minimum | Intel Core i5-8400 or AMD Ryzen 5 2600X, with AVX2 support | 8 GB RAM | GTX 1060, RX 480, or Arc A380 with 4 GB VRAM | Windows 10 64-bit or Windows 11; 90 GB; SSD required |
| Windows | Recommended | Intel Core i7-13700K or AMD Ryzen 7 7800X3D, with AVX2 support | 16 GB RAM | RTX 3070, RX 6800, or Arc A770 with 8 GB VRAM | Windows 11; 90 GB; SSD required |
| Linux | Minimum | Intel Core i5-8400 or AMD Ryzen 5 2600X, with AVX2 support | 8 GB RAM | GTX 1060, RX 480, or Arc A380 with 4 GB VRAM | Ubuntu 24.04 or higher; 90 GB; SSD required |
| Linux | Recommended | Intel Core i7-13700K or AMD Ryzen 7 7800X3D, with AVX2 support | 16 GB RAM | RTX 3070, RX 6800, or Arc A770 with 8 GB VRAM | Ubuntu 24.04 or higher; 90 GB; SSD required |
| macOS | Minimum | Apple M2 Pro, Apple silicon only | 16 GB RAM | Apple M2 Pro | macOS Sequoia 15.7 or higher; 90 GB; SSD required |
| macOS | Recommended | Apple M4 Pro, Apple silicon only | 24 GB RAM | Apple M4 Pro | macOS Sequoia 15.7 or higher; 90 GB; SSD required |
A machine above the minimum specification can still encounter low frame rates or simulation slowdown on a complex save. Conversely, a settings reduction can help a GPU-limited system without changing the CPU’s ability to advance a large simulation.
Enable the in-game FPS display for consistent comparisons
The experimental option debugInfoShowFps can display the current FPS in a corner of the application when set to true. Close the game before editing experimental options. Use the counter to compare the same camera view and simulation state before and after a change.
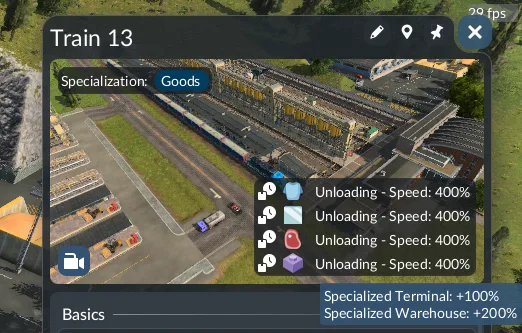
The FPS readout appears in the upper-right corner; compare your own values in the same view and simulation state.
FPS alone does not measure simulation speed. Pair it with the pause test and the 2× or 4× comparison. A high displayed frame rate can coexist with a simulation that cannot advance at the selected multiplier, while low paused FPS points more directly toward rendering load.