
In Transport Fever 3, the practical solution to a perishable cargo problem is to shorten or protect the cargo’s total delivery time. Open the Cargo Satisfaction layer, filter it to the affected cargo, follow the colored route, and then compare the relevant line and vehicle statistics. Red indicates a longer delivery time, but it does not identify the cause by itself. You still need to inspect loading, waiting, travel, transfers, storage, and final unloading.
Late cargo continues to provide full income. The penalty is a lower on-time Delivery rating, which can hinder town growth. Diagnose the delivery-performance limit shown by the game. A red route does not by itself show that cargo has disappeared or that payment has been reduced; inspect the carried load and receiving town’s Delivery rating.
Specialized warehouse modules can freeze a cargo item’s delivery timer while it is stored and can improve loading and unloading speed. That protection applies only during storage in the specialized module. It does not protect cargo while it waits elsewhere, travels in a vehicle, transfers through another stage, or approaches its final destination.
Find the affected cargo first
Begin with the Cargo Satisfaction layer. It colors routes, vehicles, and warehouses from red to green according to cargo delivery time, with red representing longer delivery times. Vehicles also show an icon for their current cargo load and delivery time.
Use the layer’s cargo dropdown to select the exact cargo you are troubleshooting. This matters on networks where the same road, rail corridor, station, or vehicle line carries several products. An unfiltered view can make a shared segment look generally unhealthy even when only one cargo is arriving late.
Follow the selected cargo through its entire journey:
- Start at the producing industry and confirm that a suitable line actually collects the cargo.
- Inspect the first loading point for accumulated output, slow loading, vehicle queues, or an unsuitable departure rule.
- Trace the vehicle’s route and look for slow infrastructure, congestion, or long gaps between vehicles.
- Inspect every transfer point, including any warehouse used between transport modes.
- Follow the final leg to the receiving town or other consumer.
- Check the receiving town’s Delivery rating after correcting the weak stage.
Do not interpret a red section as proof of spoilage, deletion, or one specific fault. The color tells you where delivery time is long. The actual cause may be earlier in the chain, particularly when cargo reaches a transfer point after already spending too long in transit.
Also separate late delivery from excess output at an industry. Produced cargo remains at the industry until a suitable vehicle collects it. If the industry’s output stock reaches its upper limit, production continues but excess cargo items are destroyed. That stock-capacity loss is a different condition from cargo arriving late at its destination.
Compare lines without misreading the numbers
After locating the affected corridor, open Line Statistics and restrict your comparison to lines that currently transport the selected cargo. The Cargo column represents cargo actually being transported, not merely the cargo allowed by the line configuration.
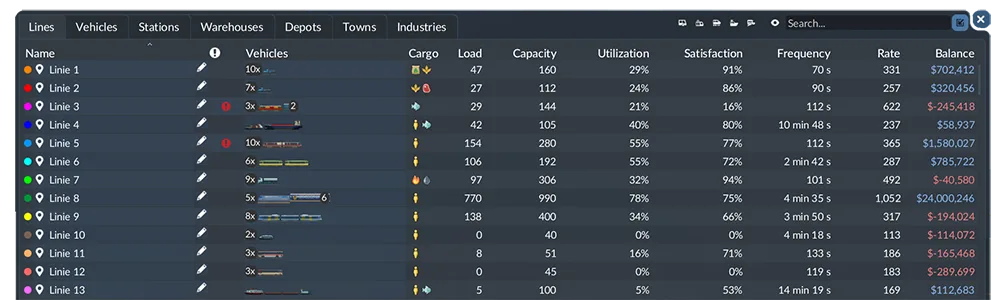
Compare line metrics separately from end-to-end delivery time.
Use the columns together rather than treating one number as the answer:
| Line statistic | What it tells you | What it does not prove |
|---|---|---|
| Satisfaction | Current satisfaction of cargo on the line | The exact station, wait, or track segment causing the delay |
| Frequency | Real-time interval between two vehicles at normal game speed | Total end-to-end delivery time for a cargo item |
| Rate | Average yearly cargo or passengers transported per station | Whether an individual delivery arrives on time |
| Load | Cargo currently carried by the line’s vehicles | Whether the available capacity is well matched to demand |
| Capacity | Combined cargo capacity of all vehicles on the line | Whether vehicles depart at useful intervals or load quickly |
| Utilization | Percentage of available cargo capacity currently used | Whether transfer and final-delivery stages are fast enough |
| Problems | Warnings reported for the line | Every possible cause of long cargo delivery time |
Frequency and Rate are especially easy to confuse. A shorter Frequency means vehicles arrive more often, while Rate describes average yearly throughput per station. Neither number alone measures an individual cargo item’s complete journey to its final receiver. A line can have a respectable Rate while a particular cargo still spends too long loading, transferring, or completing its last leg.
Line Satisfaction summarizes all cargo on that line, and Vehicle Satisfaction summarizes the cargo loaded by that vehicle. Selecting a cargo in the map layer does not establish that a mixed line’s statistics isolate that cargo. Use the Cargo column to identify what is actually aboard, compare equivalent cargo loads where possible, and return to the filtered map layer when a mixed summary is ambiguous.
Compare lines that perform equivalent stages of the selected cargo’s journey. A feeder truck line, a long-distance rail line, and a final urban delivery line have different roles, so ranking them by Rate alone will not identify the weakest stage. Instead, use Satisfaction to find the suspicious line and then inspect how that line operates.
Narrow the problem to individual vehicles
Vehicle Statistics can distinguish a line-wide weakness from a problem concentrated in particular vehicles. The view includes each vehicle’s current cargo, line, load, capacity, utilization, satisfaction, condition, and reported problems.
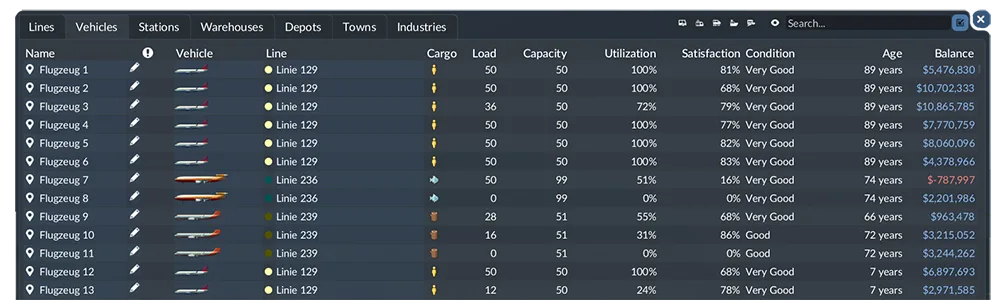
Use vehicle-level statistics to isolate affected vehicles.
Filter your reasoning by the Cargo column. On a mixed network, do not compare a vehicle carrying the affected cargo with an empty vehicle or one carrying another product and assume their Satisfaction values describe the same journey.
Look for patterns:
- If most vehicles on the same line show weak cargo satisfaction, inspect the line’s frequency, path, station behavior, and terminal capacity.
- If only certain vehicles are weak, compare their current route position, observed station or traffic waits, and whether their loading behavior differs. Do not infer when an item’s timer started from the vehicle’s previous movements.
- If vehicles are heavily loaded and cargo accumulates at the source, capacity or service frequency may be insufficient.
- If vehicles run with spare capacity but cargo still arrives late, investigate waiting rules, loading speed, travel time, transfers, and the final leg before adding more vehicles.
- If the line or vehicle reports a warning, resolve that concrete warning before making unrelated network changes.
Do not use the Station Statistics Delay value as a cargo-lateness counter. That measure concerns unhappy passengers, not timed cargo delivery. The filtered Cargo Satisfaction layer, line and vehicle summaries interpreted against their actual loads, warehouse remaining time, and the receiving town’s Delivery rating are the relevant checks here.
Check cargo selection and station waiting
A long wait can begin before the first vehicle moves. Inspect the stop configuration for the exact cargo. Each stop can be configured with cargo types to load and a load percentage, and the selected cargo icons are visible in the line manager.
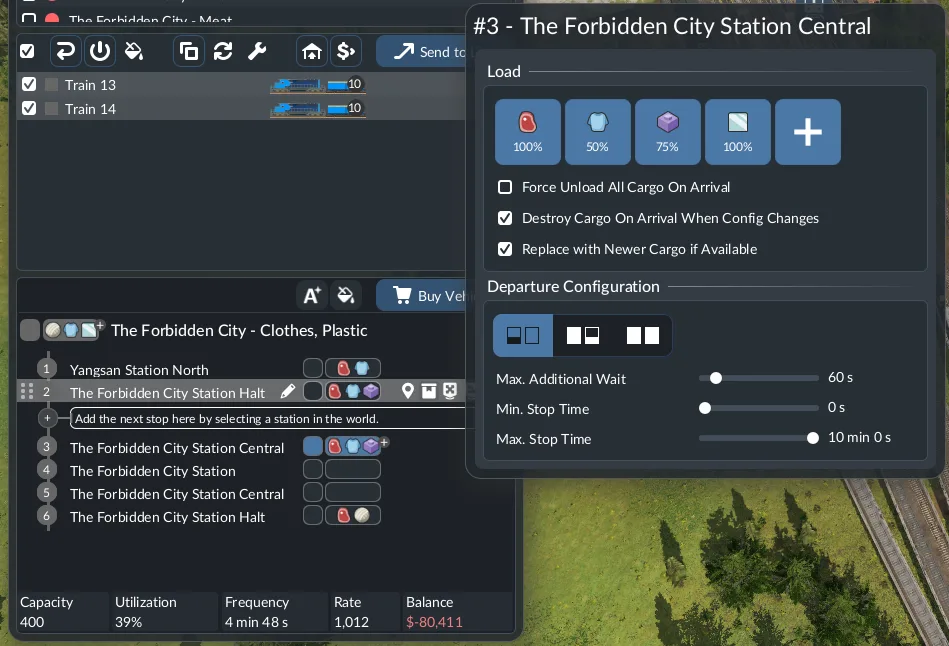
Verify that the affected cargo is enabled at the relevant pickup and transfer stops.
Confirm that the intended cargo is enabled at the pickup stop and that the line is using a departure mode appropriate to the available supply. The three departure behaviors are:
- Load if available: the vehicle stops and loads compatible cargo that is ready.
- Full load (any): the vehicle waits until one cargo type is fully loaded.
- Full load (all): the vehicle waits until it is fully loaded.
For trains and ships, “any” and “all” can differ because those vehicles may have separate compartments or wagons and can carry several cargo types. Other vehicle types wait for a full load under either full-load option.
A full-load rule can create a long origin wait when production is too slow or supply is intermittent. An additional configured wait time can also hold a vehicle after loading or unloading so the simulation can distribute vehicles more evenly along the line. Even spacing may help the line, but the added station time still belongs in your diagnosis when cargo is approaching its delivery limit.
Do not change every stop at once. Adjust the rule at the stage where you observed the delay, then compare the same cargo’s route color and Satisfaction after the network has operated with the new setting.
Fix loading and unloading delays
Loading speed varies by cargo type and is shown as a percentage in the vehicle window. Hover the cargo’s loading-status row to view the detailed modifiers. Matching vehicle, terminal, and applicable warehouse specializations can increase loading speed; mismatched specializations can reduce it. The loading HUD indicator also shows whether loading is occurring at a normal, increased, or decreased rate.
For trains and trams, compare platform length with vehicle length. A platform shorter than the train or tram slows loading and unloading. The vehicle window, station window, and terminal-selection dialog can display a warning when this occurs. If that warning appears on the late cargo’s route, correct the platform mismatch or use a vehicle consist that fits the available platform.
Watch the full station cycle rather than only the travel portion. A fast train does not solve a route if it spends too long loading at the producer, queues outside a terminal, waits under a departure rule, or unloads slowly at the transfer point. Likewise, adding capacity may fail when the station cannot process the existing vehicles quickly enough.
Use this order when investigating a loading point:
- Confirm that the selected cargo is allowed at the stop.
- Check whether the cargo is physically available to load.
- Read any platform-length or line problem warning.
- Inspect the vehicle’s cargo-specific loading percentage and modifiers.
- Check for mismatched specializations.
- Review the departure rule and any additional wait time.
- Observe whether vehicles queue before entering the terminal.
- Change the specific constraint you found and recheck Satisfaction.
Improve travel and transfer stages
If loading is healthy, trace the moving vehicle along the Cargo Satisfaction layer. A long delivery can result from the route itself, the interval between services, or time lost at a transfer.
For a road service, compare the cargo route with visible traffic conditions. Congestion can extend the travelling portion even when the line has enough nominal capacity. For rail, inspect the infrastructure used by the affected service for restrictive sections and operational warnings. The infrastructure view can show speed limits along roads and tracks, but a displayed limit is only one part of the route; waiting for access or being held behind other traffic can also extend the trip.
At a transfer, verify that the next line actually carries the cargo and arrives often enough to collect it. Frequency tells you the interval between vehicles, so it is useful when cargo spends substantial time waiting for the next service. Rate helps you compare throughput, while Load, Capacity, and Utilization show whether the line is moving enough cargo when it does arrive.
Do not apply a fleet-size formula or an invented target Frequency. The correct change depends on the observed bottleneck. Possible responses include increasing service frequency, using suitable capacity, removing a loading restriction, reducing avoidable station waiting, improving the route, or correcting a transfer that does not collect the cargo reliably. Make the smallest change that addresses the visible weak stage.
Use storage without hiding the real delay
Open the warehouse’s Stocks section when the cargo passes through storage. Each module row shows the supported cargo, the amount currently stored, and its average remaining delivery time. This lets you compare modules and see whether the selected cargo reaches storage with little time remaining.
A specialized module freezes the delivery timer while the cargo item is stored. It also provides faster loading and unloading. Specializations are available for Liquid, Bulk, Flatbed, and Goods, and each specialized module can hold only one cargo type at a time. If two cargo types in the same category need specialized storage, they require separate modules.
A universal warehouse offers flexible mixed-cargo storage. When timer protection is the purpose of storage, use a suitable specialized module and inspect its Stocks row rather than treating mixed-cargo flexibility as proof of timer protection.
The specialized module’s timer freeze concerns time inside that storage. Check the remaining time when cargo reaches the module and reassess delivery performance after it leaves; do not treat the storage benefit as evidence that the moving vehicle or the rest of the route is protected. A transfer design can therefore include protected storage and still perform poorly because the inbound trip, loading operation, outbound wait, or last-mile service is too slow.
Remember that town buildings and factories cannot directly consume warehouse contents. Cargo still has to be transported from the warehouse to the destination. The warehouse only participates in storage and transfer when it is within the station’s catchment radius.
Verify the result at the destination
After changing the identified bottleneck, return to the Cargo Satisfaction layer and select the same cargo again. Compare the same route, lines, vehicles, and warehouse modules rather than judging the change from a different cargo or an unrelated service.
Use this completion check:
- Confirm that the affected cargo still follows the intended route.
- Check whether the previously red or weak stage now shows a better delivery-time state.
- Compare Satisfaction on the relevant line and its vehicles.
- Recheck warehouse average remaining delivery time if storage is part of the route.
- Confirm that cargo completes the final leg to the receiving town.
- Inspect the town’s Delivery rating to see whether more cargo is arriving on time.
Delivery is one of six ratings used by the Town Authority, and the overall authority value is determined by the lowest rating. Improving late cargo can therefore improve the Delivery component without guaranteeing immediate town growth. If another rating remains lower, that other constraint can continue to limit the town.
Avoid judging success only by income. Delayed cargo still provides full income, so a profitable line can continue to damage the on-time Delivery rating. The useful result is a healthier cargo-specific delivery state and an improved destination Delivery rating, not merely continued revenue.